Hello everyone,
I'm excited to showcase my first Power BI project and the data-driven insights I've created.
Title: E-commerce Sales Dashboard: Unveiling Sales Insights and Performance
Introduction: The E-commerce Sales Dashboard is designed to provide valuable insights and analysis of sales performance in our online business. This comprehensive data-driven dashboard offers a visual representation of key metrics, enabling us to understand customer behavior, identify top-performing regions, analyze payment preferences, and evaluate profitability.
Process:
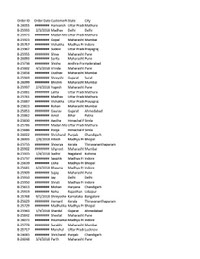
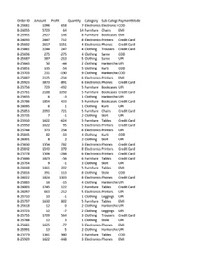
1) Import the CSV file in Power Bl
2) ETL
3) Data Modelling
4) Created Calculated Measures Using DAX (Data Analysis Expressions)
5) Added Filters and Slicers
6) Design Visualizations and Create Dashboard
Insights:
• Sum of Amount by State: Maharashtra, Madhya Pradesh, Uttar Pradesh, Delhi, and Rajasthan emerged as the top states contributing to sales revenue. These regions exhibit strong market potential and should be a focus for further growth strategies.
• Sum of Amount by Customer Name: Customer analysis reveals that Harivansh, Madhav, Madan Mohan, Shiva, and Vishakha are among the top contributors to overall sales revenue. Personalized marketing efforts and loyalty programs can be targeted towards these high-value customers to maximize their potential.
• Sum of Quantity by Payment Mode: Analysis of payment preferences highlights that EMI and credit card transactions account for a significant portion of sales, followed by cash on delivery, debit card, and UPI. Understanding customer payment preferences aids in optimizing the payment options offered.
• Sum of Quantity by Category: The distribution of quantity sold across categories indicates that furniture and electronics are popular, contributing 17% and 21% respectively, while clothing accounts for the majority with 63%. This insight helps align inventory management and marketing strategies accordingly.
• Sum of Profit by Subcategory: The profitability analysis reveals that printers, bookcases, sarees, accessories, and tables are the top-performing subcategories. These insights can guide product offerings, marketing investments, and resource allocation for maximum profitability.
• Profit by Month: Analyzing profit trends over time indicates substantial growth in profitability. From $1 million in 2013, profits rose to $11 million in 2014, indicating a positive trajectory and successful business strategies.
Conclusion: The E-commerce Sales Dashboard provides actionable insights on top-performing regions, high-value customers, popular product categories, and profitable subcategories. It enables informed decisions for optimizing marketing strategies, payment options, and identifying growth opportunities. Harnessing data-driven decision-making, the dashboard empowers success in the competitive e-commerce industry.
#dataanalysis #powerbi #project #datavisualization
I'm excited to showcase my first Power BI project and the data-driven insights I've created.
Title: E-commerce Sales Dashboard: Unveiling Sales Insights and Performance
Introduction: The E-commerce Sales Dashboard is designed to provide valuable insights and analysis of sales performance in our online business. This comprehensive data-driven dashboard offers a visual representation of key metrics, enabling us to understand customer behavior, identify top-performing regions, analyze payment preferences, and evaluate profitability.
Process:
1) Import the CSV file in Power Bl
2) ETL
3) Data Modelling
4) Created Calculated Measures Using DAX (Data Analysis Expressions)
5) Added Filters and Slicers
6) Design Visualizations and Create Dashboard
Insights:
• Sum of Amount by State: Maharashtra, Madhya Pradesh, Uttar Pradesh, Delhi, and Rajasthan emerged as the top states contributing to sales revenue. These regions exhibit strong market potential and should be a focus for further growth strategies.
• Sum of Amount by Customer Name: Customer analysis reveals that Harivansh, Madhav, Madan Mohan, Shiva, and Vishakha are among the top contributors to overall sales revenue. Personalized marketing efforts and loyalty programs can be targeted towards these high-value customers to maximize their potential.
• Sum of Quantity by Payment Mode: Analysis of payment preferences highlights that EMI and credit card transactions account for a significant portion of sales, followed by cash on delivery, debit card, and UPI. Understanding customer payment preferences aids in optimizing the payment options offered.
• Sum of Quantity by Category: The distribution of quantity sold across categories indicates that furniture and electronics are popular, contributing 17% and 21% respectively, while clothing accounts for the majority with 63%. This insight helps align inventory management and marketing strategies accordingly.
• Sum of Profit by Subcategory: The profitability analysis reveals that printers, bookcases, sarees, accessories, and tables are the top-performing subcategories. These insights can guide product offerings, marketing investments, and resource allocation for maximum profitability.
• Profit by Month: Analyzing profit trends over time indicates substantial growth in profitability. From $1 million in 2013, profits rose to $11 million in 2014, indicating a positive trajectory and successful business strategies.
Conclusion: The E-commerce Sales Dashboard provides actionable insights on top-performing regions, high-value customers, popular product categories, and profitable subcategories. It enables informed decisions for optimizing marketing strategies, payment options, and identifying growth opportunities. Harnessing data-driven decision-making, the dashboard empowers success in the competitive e-commerce industry.
#dataanalysis #powerbi #project #datavisualization